Showing posts with label Energy Descent. Show all posts

Friday, 22 November 2013

Post nuclear differences

In the wake of the Fukushima Daiichi nuclear power station disaster in early 2011 both Japan and Germany changed their stance on nuclear power generation. Some nuclear plants were shut down immediately and the rest will most likely be decommissioned with the next decade.  Both countries appeared to have widespread public support for this radical change in their national energy policy.
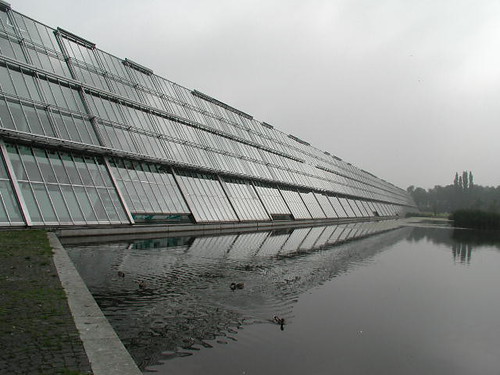
Solar city, science park, Gelsenkirchen.
Source: Green Baroque Ins. Flickr under Creative
Commons CC BY-NC 2.0 Licence 

The effect these decisions have had on these two nations response to climate change is interesting.  Germany was already well into building out its solar & wind based renewable generation capacity before the earthquake and tidal wave wrecked the reactors in Japan. With widespread community involvement in the investment in renewables, and helpful financial and regulatory environment provided by the German authorities,  they've been able carry this forward.  They've still got fossil fuels in their mix but they do still seem to be on target for their carbon emissions targets.  Germany already had a strong anti-nuclear movement and was planning on phasing out nuclear by 2036 anyway so this event really accelerated that timetable.

Japan on the other hand have just announced during the UN COP19 climate change talks that they were going to have to substantially reduce their existing emissions reduction target.  They are building renewable generating capacity of course - practically every developed nation is.  However it will not be enough to cope with losing all the nuclear generating capacity that they are removing,  which prior to March 2011 contributed around 30% of their total generating capacity.  They are having to turn to increasing use of imported fossil fuels as oil, coal and gas to supply their electricity.

I was wondering what we could learn from the different outcomes arising from what, at first, appear to be very similar decisions.  Germany had something of a head start as they were already aggressively building solar PV & wind generators. But they also have a geographic  advantage over Japan: Germany is bigger with more land available.  Solar & wind both have low "energy density" so to get a decent amount generated you need alot of them covering lots of roofs & land. Japan is a relatively crowded country so space is at a much higher premium.  As a comparison Japan is 39th in the population density league table whereas Germany is 58th.  Japan does have potential for many gigawatts of renewable power generation though, as it has amply space in the seas around it for large scale off-shore wind farms.  There does appear to be the need to encourage more community involvement and investment in on-shore renewables though.
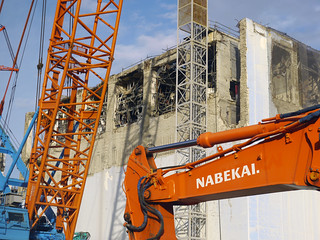
Fukushima Unit 4 with cranes working on 
stabilizing the site. Source: IAEA Imagebank under 
Creative Commons CC BY-NC-ND 2.0 Licence

Both nations have to bear the costs of decommissioning their nuclear infrastructure, which will mostly likely be a long and expensive task.  Again Germany has an advantage - it only had 17 nuclear power stations operating prior to March 2011 whereas Japan had over 50.  Germany was already well into decommissioning quite a few reactors, especially from the former East Germany.

Japan also has the expense and difficulty of cleaning up Fukushima itself to deal with. That's going to be a big drain on the resources of both its owner Tepco and the Japanese government. The clean up may well be competing for funds, people and time required to ramp up construction of  renewables, even though those renewables are part of the solution to the overall problem. Indeed one wonders if the exclusion zone around Fukushima might well end up being a good place to site renewables with their relatively low maintenance requirements (so fewer people have to spend less time in the potentially more radioactive areas).  At least they might provide some economic payback to the people whose land is otherwise now worthless.

Japan's economy has taken some serious blows over the last few years, which also puts them at a disadvantage against Germany. Germany is the economic power house of the EU, and so it can afford to invest in the capital cost of renewables. Indeed its a positive cycle for the Germans: the more renewables they can invest in the more insulated they are from fossil fuel price rises, which improves their competitiveness and increases their income, part of which they can invest in more renewables.  Japan has the opposite problem - its emergency switch to large scale fossil fuels to replace the nuclear power stations is costing the Japanese power companies an extra 3.6 trillion yen in 2013 over the costs in 2010 before the disaster.  Things are likely to get worse for Japan before they start to get better.

There is one overarching "take home message" I pick up from the different reaction to the change in energy policy in the two countries.  The sooner a nation starts to make a large scale switch to distributed renewable power generation, the better placed it is likely to be to deal with sudden, external changes in traditional centralized power generation.  In this case it was the rapid removal of all nuclear capacity but in the future who knows what it will be?  Gas pipelines cut off as part of national sabre rattling? Wars leading rapid price rises in global oil prices? Coal shipments being disrupted by industrial unrest?  All of these could affect national grids that rely too heavily on one particular fuel source, especially if that fuel is controlled by others.  We all need to be investing in clean, distributed energy generation to make our nations, towns, cities and communities more resilient in the face of these unexpected changes.

Monday, 2 April 2012

Powering Down Loughborough: Energy Descent Plan Part 1

One of the things that many Transition Town groups across the planet have done is start to draw up "energy descent" plans. These are documents that look at how much energy a town is using, what potential it has to generate cleaner energy itself and then it gives some more concrete targets for energy reduction programmes (insulation, unnecessary energy use, etc).

I've been thinking a bit about how we'd tackle that in Loughborough on and off over the last year or so, and I brain dumped what I'd come up with on the Transition Loughborough mailing list last summer, to little discussion. I've been thinking more about this again recently, especially with the recent panic in the UK about fuel strikes and several nuclear power station plans being dropped by the commercial groups that were developing them. I thought it was about time I revisited this and cast the net for comments a bit wider than the somewhat closed Transition Loughborough Google Group. This post is thus an updated version of the posting I made last summer with a few revisions and updates thrown in.

To get the ball rolling, I thought I'd just look at electricity use to start with. Of course there's also oil used in transport, gas used for cooking/heating and the use of fossil fuel derived non-fuel products (plastics, fertilizers, etc), but I had to start somewhere and electricity seemed tractable for finding numbers, making some estimates, etc.

First off I wanted to "guestimate" what the current electricity usage in Loughborough is. Unfortunately there's not a big kWh meter attached to the pylons that stride over Loughborough Moor, so I had to do a bit of research and number crunching. Here's some figures I've nabbed from various sources:


  • Loughborough population - 57,600 people (source: Wikipedia/Charnwood BC),
  • Average UK per capita electricity consumption: 6106kWh (source: World Bank via Google's Public Data Explorer. This covers both domestic use and each person's share of commercial/industrial electricity usage). 
Sticking to our combined domestic/commercial/industrial figures means that we can guesstimate that Loughborough has an annual electrical energy usage of:

57600 x 6106 = 351705600kWh = 351705.6MWh = 351.7056GWh

If we divide this by the number of hours in a year, we'll get the average power:

351705600 / (365 x 24) = 40149.04109589kW

Lets call that 40MW to be nice and round, especially as the population and per capita electricity usage figures come from different years. This is the average requirement - peaks in demand will be higher. Conveniently, the National Grid total typical consumption is 40GW across the whole country, with peaks up to 60GW, so we could expect that Loughborough might need to have generating capacity up to 60MW on hand if the ratio is similar to the nation as a whole.

What I was wondering was what renewable energy sources we could deploy in and around the town to meet this demand. If we could do more than required then groovy, we're looking good for a local energy generation plan. If we can't meet this demand we'll need to look at what can be shaved off and/or rely on "external" power generation from the National Grid (off shore wind, hydro, nuclear, etc. If we're aiming for a low carbon/post-Peak Oil target we'll want to reduce/remove the demand for fossil fuel based generation as well obviously, so we'd rather not have oil/coal/gas fired stations in the mix).

My first thought was Wind Power. The BWEA/DTi wind speed trackers say that Loughborough gets just under 6m/s average winds at 45m above ground level in a variety of locations around the town. Not a great wind speed, so possibly marginal for deployment of large scale turbines. Brush Electrical did plan to build one behind their plant in Loughborough a few years ago to demonstrate some of their generators but I don't think anything came of it. The University has a small (kW scale) wind turbine that's used for research purposes and there's one or two medium sized turbines on farms around the town. So wind probably isn't our first choice for electricity generation, although if push comes to shove we might be able to squeeze a few turbines in... lets say six of those big 1MW turbines on Loughborough moors to the east of the town and on the high ground about the M1 to the south west of the town. So 6MW at most of wind as a very rough estimate. Good old Wikipedia tells us that:

1 MW turbine with a capacity factor of 35% will not produce 8,760 MWh in a year (1 × 24 × 365), but only 1 × 0.35 × 24 × 365 = 3,066 MWh, averaging to 0.35 MW.

So our six 1MW large turbines will produce 18396MWh = 18.396GWh per year

OK, what about solar PV? To work out what capacity we could have if everyone suddenly got keen on solar panels (and could afford them) I took a two pronged approach: considering first the domestic roof space available, and then the industrial roof space. I didn't want to look at ground based "solar farm" set ups as I didn't want to "waste" potential food or biomass producing land under solar panels.

For domestic roof space, I got an estimate of the number houses and flats in Loughborough from Findanewhome.com of 21,108. Now I'm not going to sit looking at Google maps to work out which of these 21,108 properties could have solar panels and how big the arrays can be. Instead I'm going to estimate that a quarter of them will be facing south east to south west and of those about half again would be suitable for PV panels (not in conservation areas, enough roof space, roof capable of taking the loading, etc):

21108 x 0.25 x 0.5 = 2638.5 suitable properties.

Now domestic PV installations seem to range in size from less that 1KWp to over 5KWp, but most seem to average out at around 2.5KWp so I'm going to use that as a ball park figure. This means that I reckon if we had enough PV panels and willing folk to stump up the cash, we could get:

2638.5 x 2.5 = 6596.25 KWp of solar PV.

Call it 6.500MWp in round numbers.

For industrial roof space I took a slightly different tack: on Google maps satellite view I measured one of the University's large buildings to be roughly 50m x 100m. A square metre of solar PV can generate about 150Wp, so a 50m x 100m roof covered in PV panels should be able to generate up to:

50 x 100 x 150 = 750000Wp = 750KWp

Lets half that to account for parts of sloping roofs that face north, have existing services on them, skylights, etc to give us 375KWp per large roof. Then I took at look on Google maps and did a rough "finger in the air" guesstimate at how many other large industrial buildings looked to be roughly the same size (or multiples thereof in some cases). I reckoned there was about 40 such buildings in Loughborough, so large industrial buildings should give us:

40 x 375 = 15000KWp = 15MWp

Combining the domestic and commercial solar PV we get 21.5MWp. Note that this is MW _peak_: this is the maximum power output that you'd get under tip top sunshine. We'll get a lot less than that on average in the UK - English Heritage reckon that a 2KWp array on a house will generate about 1.5MWh over an average UK year. That means that our combined 21.5MWp of solar would generate:

21.5 x 1500 x (1000 / 2) = 16125000KWh = 16125MWh = 16.125GWh per year

There are other renewable options available but their contribution is likely to end up being a couple of megawatts at most. I'm thinking anaerobic digestion plants running small combined heat and power plants. Farmers already have these, but they already use the energy themselves. We'd be looking at additional biomass, such as power from the sewerage plant. Even if we took all the poop from the 57600 inhabitants of the town and assume that it had 50% of around 2500KCal (10 MJ or 0.0029075KWh) dietary intake left after digestion and we could turn 20% of that remaining energy into electricity, we'd end up with:

57600 x 0.0029075 x 0.5 x 0.2 = 16.7472KWh per day
= 6112.728KWh per year

Combining the total solar PV output with our wind and AD output gives:

18.396GWh + 16.125GWh + 0.006112GWh = 34.527GWh

Lets be generous again and call it 35GWh per year. So solar PV, wind and AD of human poop combined are only going to handle about a tenth of the 351.7056GWh demand we currently have. And that's before we take into account folk who want to move from use of liquid fossil fuels in transport to electric traction. Even if my rough estimates are half of what they should be (ie I've over looked a load of usable roof space or we could get lots more wind working around the area than I assumed), we've still got a big gap to make up.

To me this is saying that we need to both massively reduce our per capita demand, and still have access to large scale centralised power sources on the Grid (large off shore wind farms, nuclear stations, etc) in addition to the decentralised renewables generation. Reduction in demand is going to be mean turning devices off, using lower power equipment, no longer illuminating the outsides of buildings to try to make them look pretty, not lighting empty fourth floor office spaces at 1am, turning off some street lights, etc. Of course if EVs or hydrogen power for transport start to take off, the demand for electricity will start rising rapidly, wiping out lots of these potential savings and still leaving us with an energy gap.